Performance Max (PMAX) campaigns have emerged as the cornerstone of PPC advertising strategies, offering unparalleled simplicity and conversions a plenty.
However, amidst their ease of setup and success, lies a significant hurdle: deciphering their performance metrics!
If you’ve ever delved into managing a PMAX campaign, you’ve likely grappled with the challenge of understanding what exactly is driving your performance. This struggle is an everyday reality for many advertisers.
But fear not, if you’ve been wrestling with this dilemma because in this post we’ll unveil our top tips for extracting actionable insight to analyse performance in PMAX.
How to analyse performance in PMAX
How To Get Asset Group Performance
Analysing the performance of asset groups allows advertisers to understand which categories of assets (such as images, headlines, and descriptions) are resonating the most with their audience.
This insight is crucial because it enables optimisation efforts, directing resources toward the creation of more effective assets.
Here’s how to pull asset group performance data:
- Go to the “Asset Groups” tab on the left sidebar, under “Campaigns.”
- Switch the asset group view from the default “Summary” to “Table.”
- Choose “Columns” at the top right of the table.
- Select all of the relevant metrics you’d like to see. For example, conversions, conversion rate, cost…
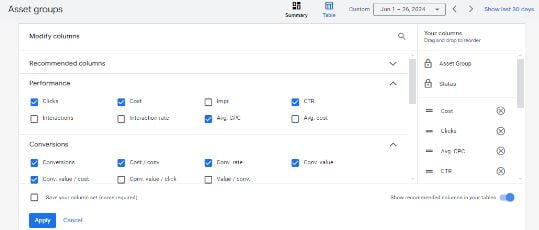
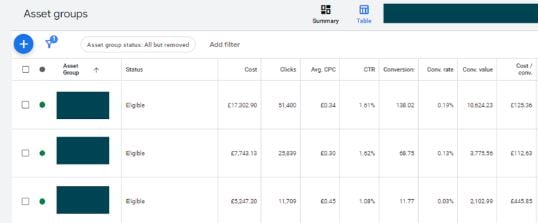
5. You will then get this view, where you can compare the key metrics and performance of different asset groups.
How To Get Search Term Performance
In a Performance Max (PMAX) campaign, pulling search term data is not as straightforward as it is in traditional search campaigns. Because PMAX uses AI across the whole of big G’s inventory, it picks and chooses where to place the ad based on what it thinks is the optimal conversion path.
This means it cloaks a lot of the terms and doesn’t provide you with a lot (if any) data on what terms are triggering what.
However, there are a few things you can do to gain insights into the search terms and queries driving performance in PMAX campaigns.
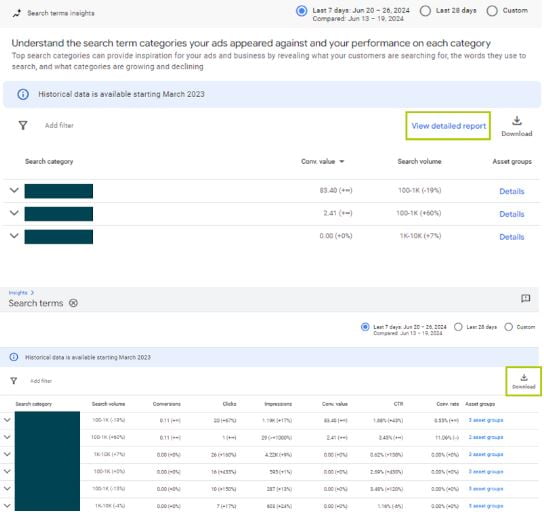
Google provides insights into the search queries that triggered your ads through the “Insights” tab in your Google Ads account.
Whilst it doesn’t give a full search term report like traditional search campaigns, it provides some valuable data which can be used to understand which terms your ads are being triggered.
Here’s how you can do it:
- Select the PMAX campaign you want to analyse.
- Click on the “Insights” tab on the left-hand side.
- Under the Insights tab, you’ll find various insights, including search trends and top search terms.
- Look for the “Search Term Insights” section where you can see aggregated data on the types of queries driving your ads:
How To Get Audience Insights In PMAX
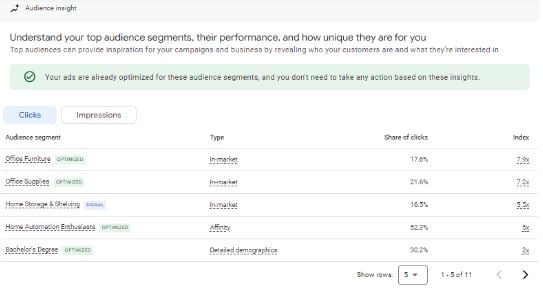
Audience insight reports offer valuable demographic and behavioral data about the audience interacting with your ads.
Understanding audience characteristics and preferences helps to tailor your targeting and messaging for maximum relevance and engagement.
How to access audience insights for PMAX campaigns:
- Select the PMAX campaign you want to analyse.
- Click on the “Insights” tab on the left-hand side.
- Scroll down until you find the audience insight section.
- Select your metric (either clicks or impressions.)
How To Get Auction Insight In PMAX
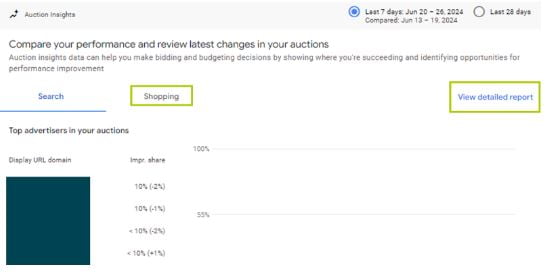
Auction insights provide visibility into competitors’ performance metrics, such as impression share and overlap rate for your campaign.
This information helps gauge your competitive landscape and adjust bidding and targeting strategies accordingly.
Unlike traditional search and shopping campaigns where auction insights are more directly accessible, PMAX campaigns do not provide auction insights in the same straightforward manner.
However, you can still get some data using the insights tab. This data isn’t as detailed as auction insights but it can still provide some competitive context.
How to get auction insights using the insights tab:
- Accessing Insights:
- Within your PMAX campaign, click on the “Insights” tab.
- Here, you can view performance trends, top search categories, and more.
How To Get Product Performance Insights
Product performance analysis delves into the performance of individual products or services promoted within the campaign.
By identifying top-performing products, advertisers can optimise bidding, targeting, and promotional strategies to drive sales and revenue.
How to pull product performance data in PMAX:
- Go to the “Products” tab in your Google Ads account.
- Here, you can see how each product is performing in terms of impressions, clicks, CTR, and conversions.
- You can add any relevant KPIs you’d like to analyse by pressing “Columns” at the top right and selecting the metrics you want to see.
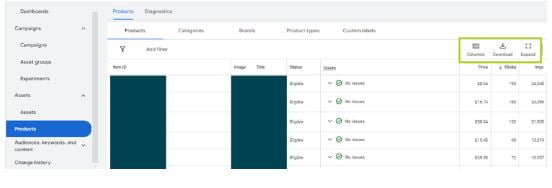
You can use this data to identify best-selling products and allocate more budget to promoting these items.
For underperforming products, consider adjusting your advertising strategy or enhancing product listings to improve performance.
How To Get Ad Schedule Performance
Analysing your ad schedules gives you insight into what times of the day and what days of the week your ads perform best. This allows you to identify the best times of the day to serve your ads to maximise your ROI.
By identifying peak activity periods and scheduling ads accordingly, advertisers can maximise exposure and optimise budget allocation for higher ROI.
How to get time of ad schedule data in PMAX
- Navigate to the “Ad Schedule” tab in Google Ads.
- Here, you can analyse performance metrics based on different times of the day and days of the week. This data is only visible if you have pre-existing ad schedules on the campaign.
If you don’t have an existing ad schedule, but would like to see the time of day data, you can do this using a custom report.
Here’s how to build it:
- On the left sidebar, choose the “Report Editor” tab, under “Insights and Reports.”
- You will see a Template Gallery, which has pre-made template reports. Scroll down until you see the “When and where ads showed” section.
- Under this, select the “When your ads showed” section.
- If you want to only see specific campaigns, you can filter this by choosing the “Filter” icon at the top of the report, choosing “Campaigns” and then selecting your desired campaigns.
- You can add or remove any metrics using the options on the right. Ensure you change the date range to the time period you want to analyse.
Some Hidden Bonus Reports You Can Use
How To Get Device Performance
You need to know which devices your ads are being served on. If you don’t know this then you can’t break down any conversion issues.
Say you’re serving a load of ads to mobile users and your site just looks awful on it. All your content is buried and people end up developing a mild case of carpal tunnel syndrome scrolling to get to it.
Your ads probably aren’t going to convert if that’s the case.
But you can’t figure that out unless you’re able to break down the device split of your PMAX campaigns.
Here’s how you can access device data for PMAX:
- Login to GA4.
- Click on the reports tab on the right.
- At the bottom right of the menu, under the section ‘Tech’, click on ‘Tech Details’.
- The data defaults to ‘Browser.’ Change this by clicking the drop-down at the top of column 1 and changing ‘Browser’ to ‘Device Category’.
- This data will be for all site users. In order to change it to just PMAX, you need to apply a filter.
- To do this, scroll to the top of the page, and under the title of the report press the button labelled ‘Add Filter’.
- In the ‘Dimensions’ window that pops up on the right, search for ‘Session primary channel group’.
- Set the match type to ’Exactly Matches’ and choose ‘Cross Network’ from the drop-down.
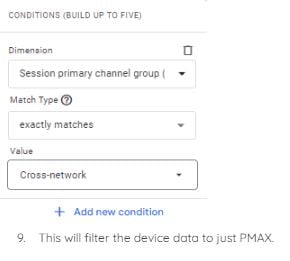
9. This will filter the device data to just PMAX.
How To Get Landing Page Performance For PMAX
Evaluating landing page performance is crucial for understanding the user journey and optimising conversion rates. Because if you don’t know which pages people are coming into, you don’t know which pages to spend your time and effort working on.
Think about it this way. You spend ages working on the UI and UX of a landing page. You make it a lean, mean, converting machine.
But PMAX is sending all your traffic to a different page. It’s wasted time right?
To make sure that doesn’t happen you need to understand where PMAX is sending the traffic. Here’s how you do it.
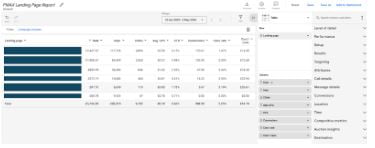
How to pull landing page performance data:
- Create a custom report under the insights tab
- Select ‘Landing Page’ as your dimension and then plug in all the metrics you want to report on.
- You can use filters to exclude campaigns or specific pages.
- Alternatively, you can do this in GA4 under the traffic section by filtering by source or specific campaign.
In Summary
From analysing asset and landing page performance to delving into audience insights and ad schedules, we’ve covered it all.
By understanding and leveraging these detailed metrics available through Google Ads and other analytics platforms, you can optimise your campaigns for better performance, higher engagement, and increased ROI.
Equipped with these new tips and knowledge, you’ll be able to make informed decisions and elevate your PMAX campaigns to new heights.

